Part 07
- Azure Monitoring Overview
- High-Level Architecture of Azure Monitor
- Enable Insights for a vm
- Configure Diagnosting settings
- Create Alerts
- Log Analytics tutorial
- Send Activity Logs to Log Analytics
Azure Monitoring Overview
Azure Monitoring is a comprehensive service that helps you collect, analyze, and act on telemetry data from your Azure resources and applications. It provides insights into the performance and health of your infrastructure, helping you diagnose and resolve issues faster.
Key Features
- Metrics Collection: Monitor performance data like CPU usage, memory consumption, and request rates.
- Log Analysis: Centralize logs from multiple sources using Azure Monitor Logs and query them with KQL (Kusto Query Language).
- Alerts: Configure rule-based alerts to notify you of critical issues.
- Visualizations: Use Azure Monitor Workbooks and integrate with Power BI for advanced dashboards.
- Integration: Works seamlessly with Azure services like Application Insights, Log Analytics, and Security Center.
Components
- Application Insights: For monitoring application performance.
- Log Analytics: For querying and analyzing log data.
- Alerts: For automated notifications based on thresholds or events.
- Workbooks: For creating rich, interactive reports.
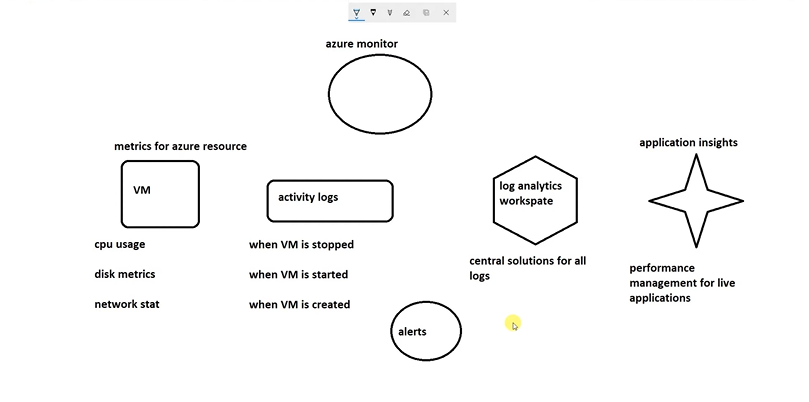
High-Level Architecture of Azure Monitor
Azure Monitor provides a unified solution for monitoring various resources across Azure, other clouds, and on-premises environments. It collects and analyzes data to provide insights into performance, availability, and health.
Types of Resources Monitored
Azure Monitor can monitor the following types of resources:
- Applications: Collect and analyze performance and usage telemetry.
- Virtual Machines: Monitor metrics and logs for Azure VMs and on-premises VMs.
- Guest Operating Systems: Track OS-level metrics and logs.
- Containers: Monitor container performance, including Prometheus metrics.
- Databases: Gain insights into database performance and operations.
- Security Events: Analyze security data when integrated with Azure Sentinel.
- Networking Events and Health: Monitor network resources in combination with Network Watcher.
- Custom Sources: Use APIs to ingest data from non-standard or custom sources.
Exporting Data from Azure Monitor
Azure Monitor enables exporting monitoring data to other systems, supporting various integration scenarios:
Third-Party and Open-Source Tools:
- Integrate with monitoring tools like Grafana, Datadog, or Splunk.
- Leverage open-source visualization tools for custom dashboards.
ITSM and Ticketing Systems:
- Connect with systems like ServiceNow or Jira to automate incident management and response workflows.

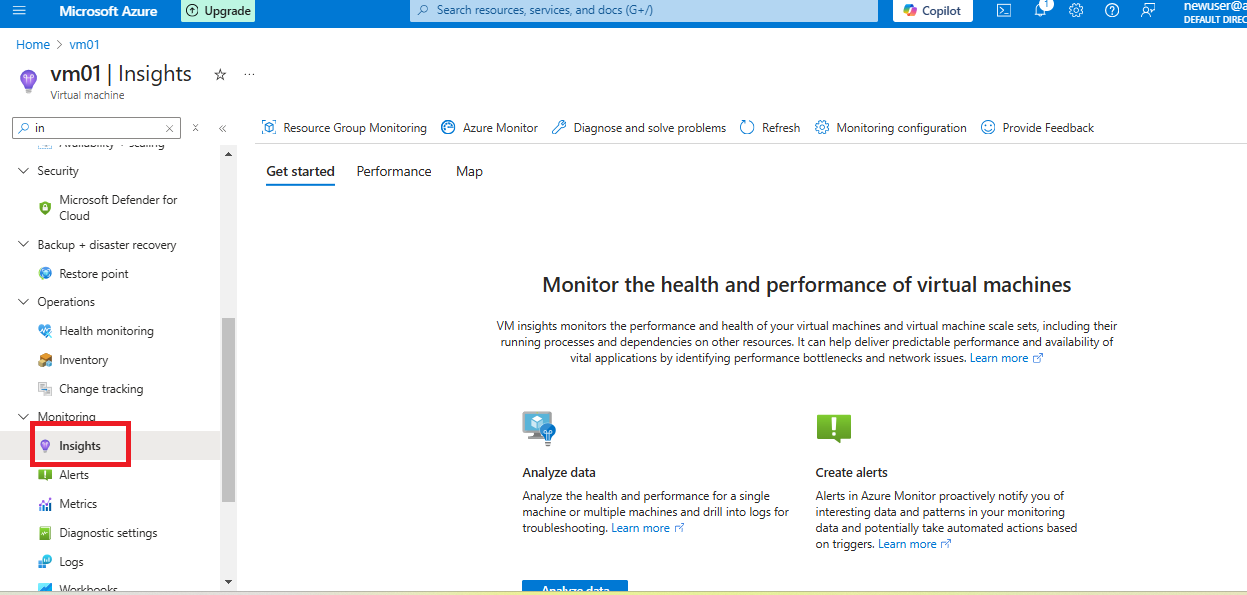
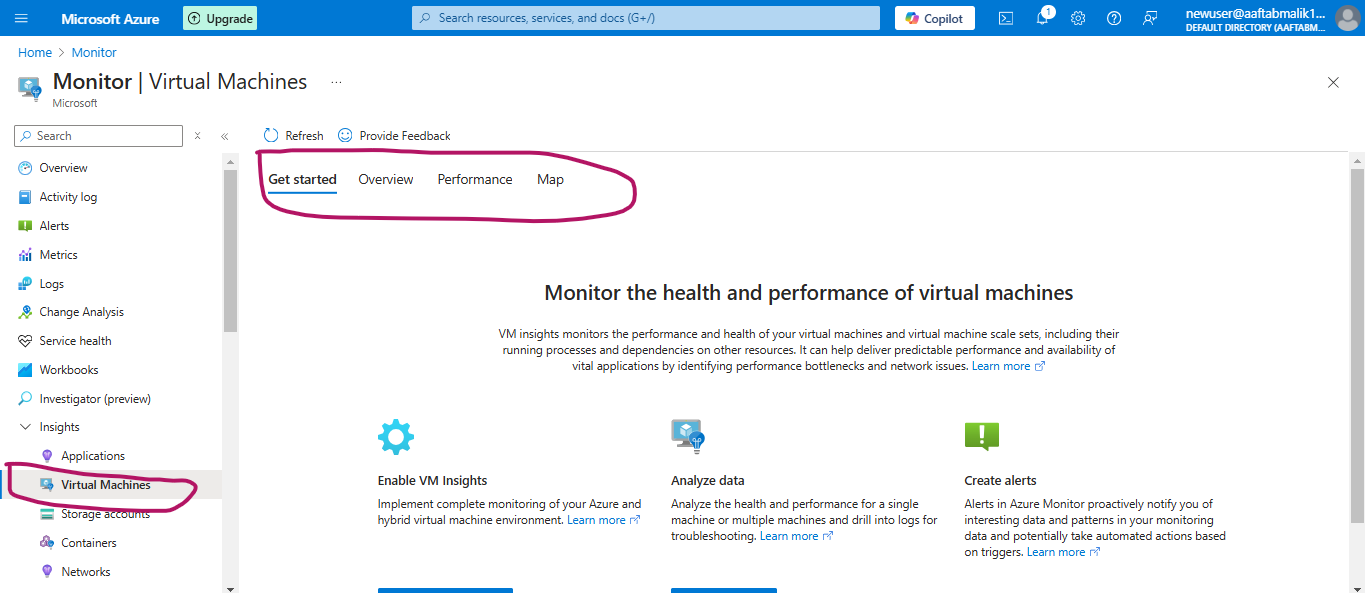
Enable insights for a vm
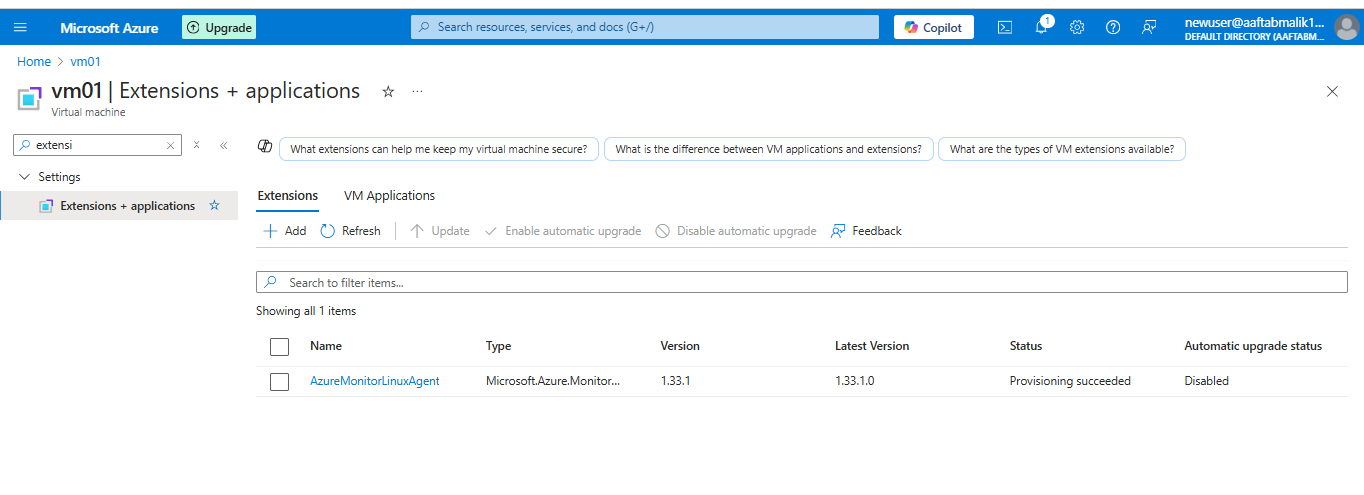
Check Monitoring extension
Also check this from Azure Monitor
Log Analytics tutorial
Log Analytics is a tool in the Azure portal to edit and run log queries from data collected by Azure Monitor logs and interactively analyze their results. You can use Log Analytics queries to retrieve records that match particular criteria, identify trends, analyze patterns, and provide various insights into your data.
This tutorial walks you through the Log Analytics interface, gets you started with some basic queries, and shows you how you can work with the results. You learn how to:
-Understand the log data schema.
- Write and run simple queries, and modify the time range for queries.
- Filter, sort, and group query results.
- View, modify, and share visuals of query results.
- Load, export, and copy queries and results.
Log Analytics in Azure Monitor
Log Analytics is a tool in Azure Monitor that enables you to collect, query, and analyze log data from various Azure resources, on-premises systems, and other environments. It helps in gaining actionable insights by querying log data using Kusto Query Language (KQL).
Key Features
Centralized Log Collection:
- Aggregate logs from Azure resources, virtual machines, containers, and custom sources.
- Supports collecting data from hybrid and multi-cloud environments.
Advanced Querying:
- Use KQL (Kusto Query Language) to query and filter log data efficiently.
- Analyze trends, detect anomalies, and identify performance bottlenecks.
Dashboards and Workbooks:
- Create custom visualizations and dashboards using Azure Workbooks.
- Integrate with Power BI for advanced reporting.
Integration with Azure Services:
- Works with Application Insights, Azure Sentinel, and Network Watcher.
- Enables real-time alerting based on log data.
Exporting Data:
- Export logs to external tools like Splunk, Grafana, or a custom SIEM for further analysis.
Use Cases
- Performance Monitoring: Analyze CPU, memory, and disk usage trends across your environment.
- Security Analysis: Detect and investigate security events in combination with Azure Sentinel.
- Audit and Compliance: Track changes to Azure resources and ensure compliance with policies.
- Troubleshooting: Use KQL to identify root causes of application or system issues.
- Container Monitoring: Collect and analyze logs from Kubernetes clusters.
Getting Started with Log Analytics
Create a Log Analytics Workspace:
- In the Azure portal, go to Monitor > Log Analytics workspaces.
- Create a new workspace or use an existing one.
Connect Data Sources:
- Add Azure resources, virtual machines, or custom log sources to the workspace.
- Enable diagnostics settings to send logs to Log Analytics.
Write Queries in KQL:
- Use the Logs blade in the Azure portal to access the Log Analytics query editor.
- Examples:
- Retrieve CPU usage for a VM:
Perf | where ObjectName == "Processor" and CounterName == "% Processor Time" | summarize avg(CounterValue) by bin(TimeGenerated, 1h) - List all failed login attempts:
SecurityEvent
| where EventID == 4625
- Retrieve CPU usage for a VM:
Set Alerts and Automations:
- Create alerts based on log queries to notify teams or trigger automation workflows.
Benefits
- Centralized log management and analysis.
- Enhanced troubleshooting with interactive queries.
- Scalable for hybrid and multi-cloud setups.
- Tight integration with Azure services and third-party tools.
Let me know if you need examples or guidance on specific KQL queries!
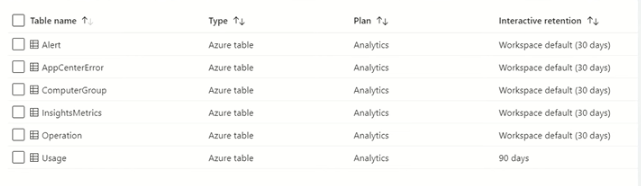
Default Tables